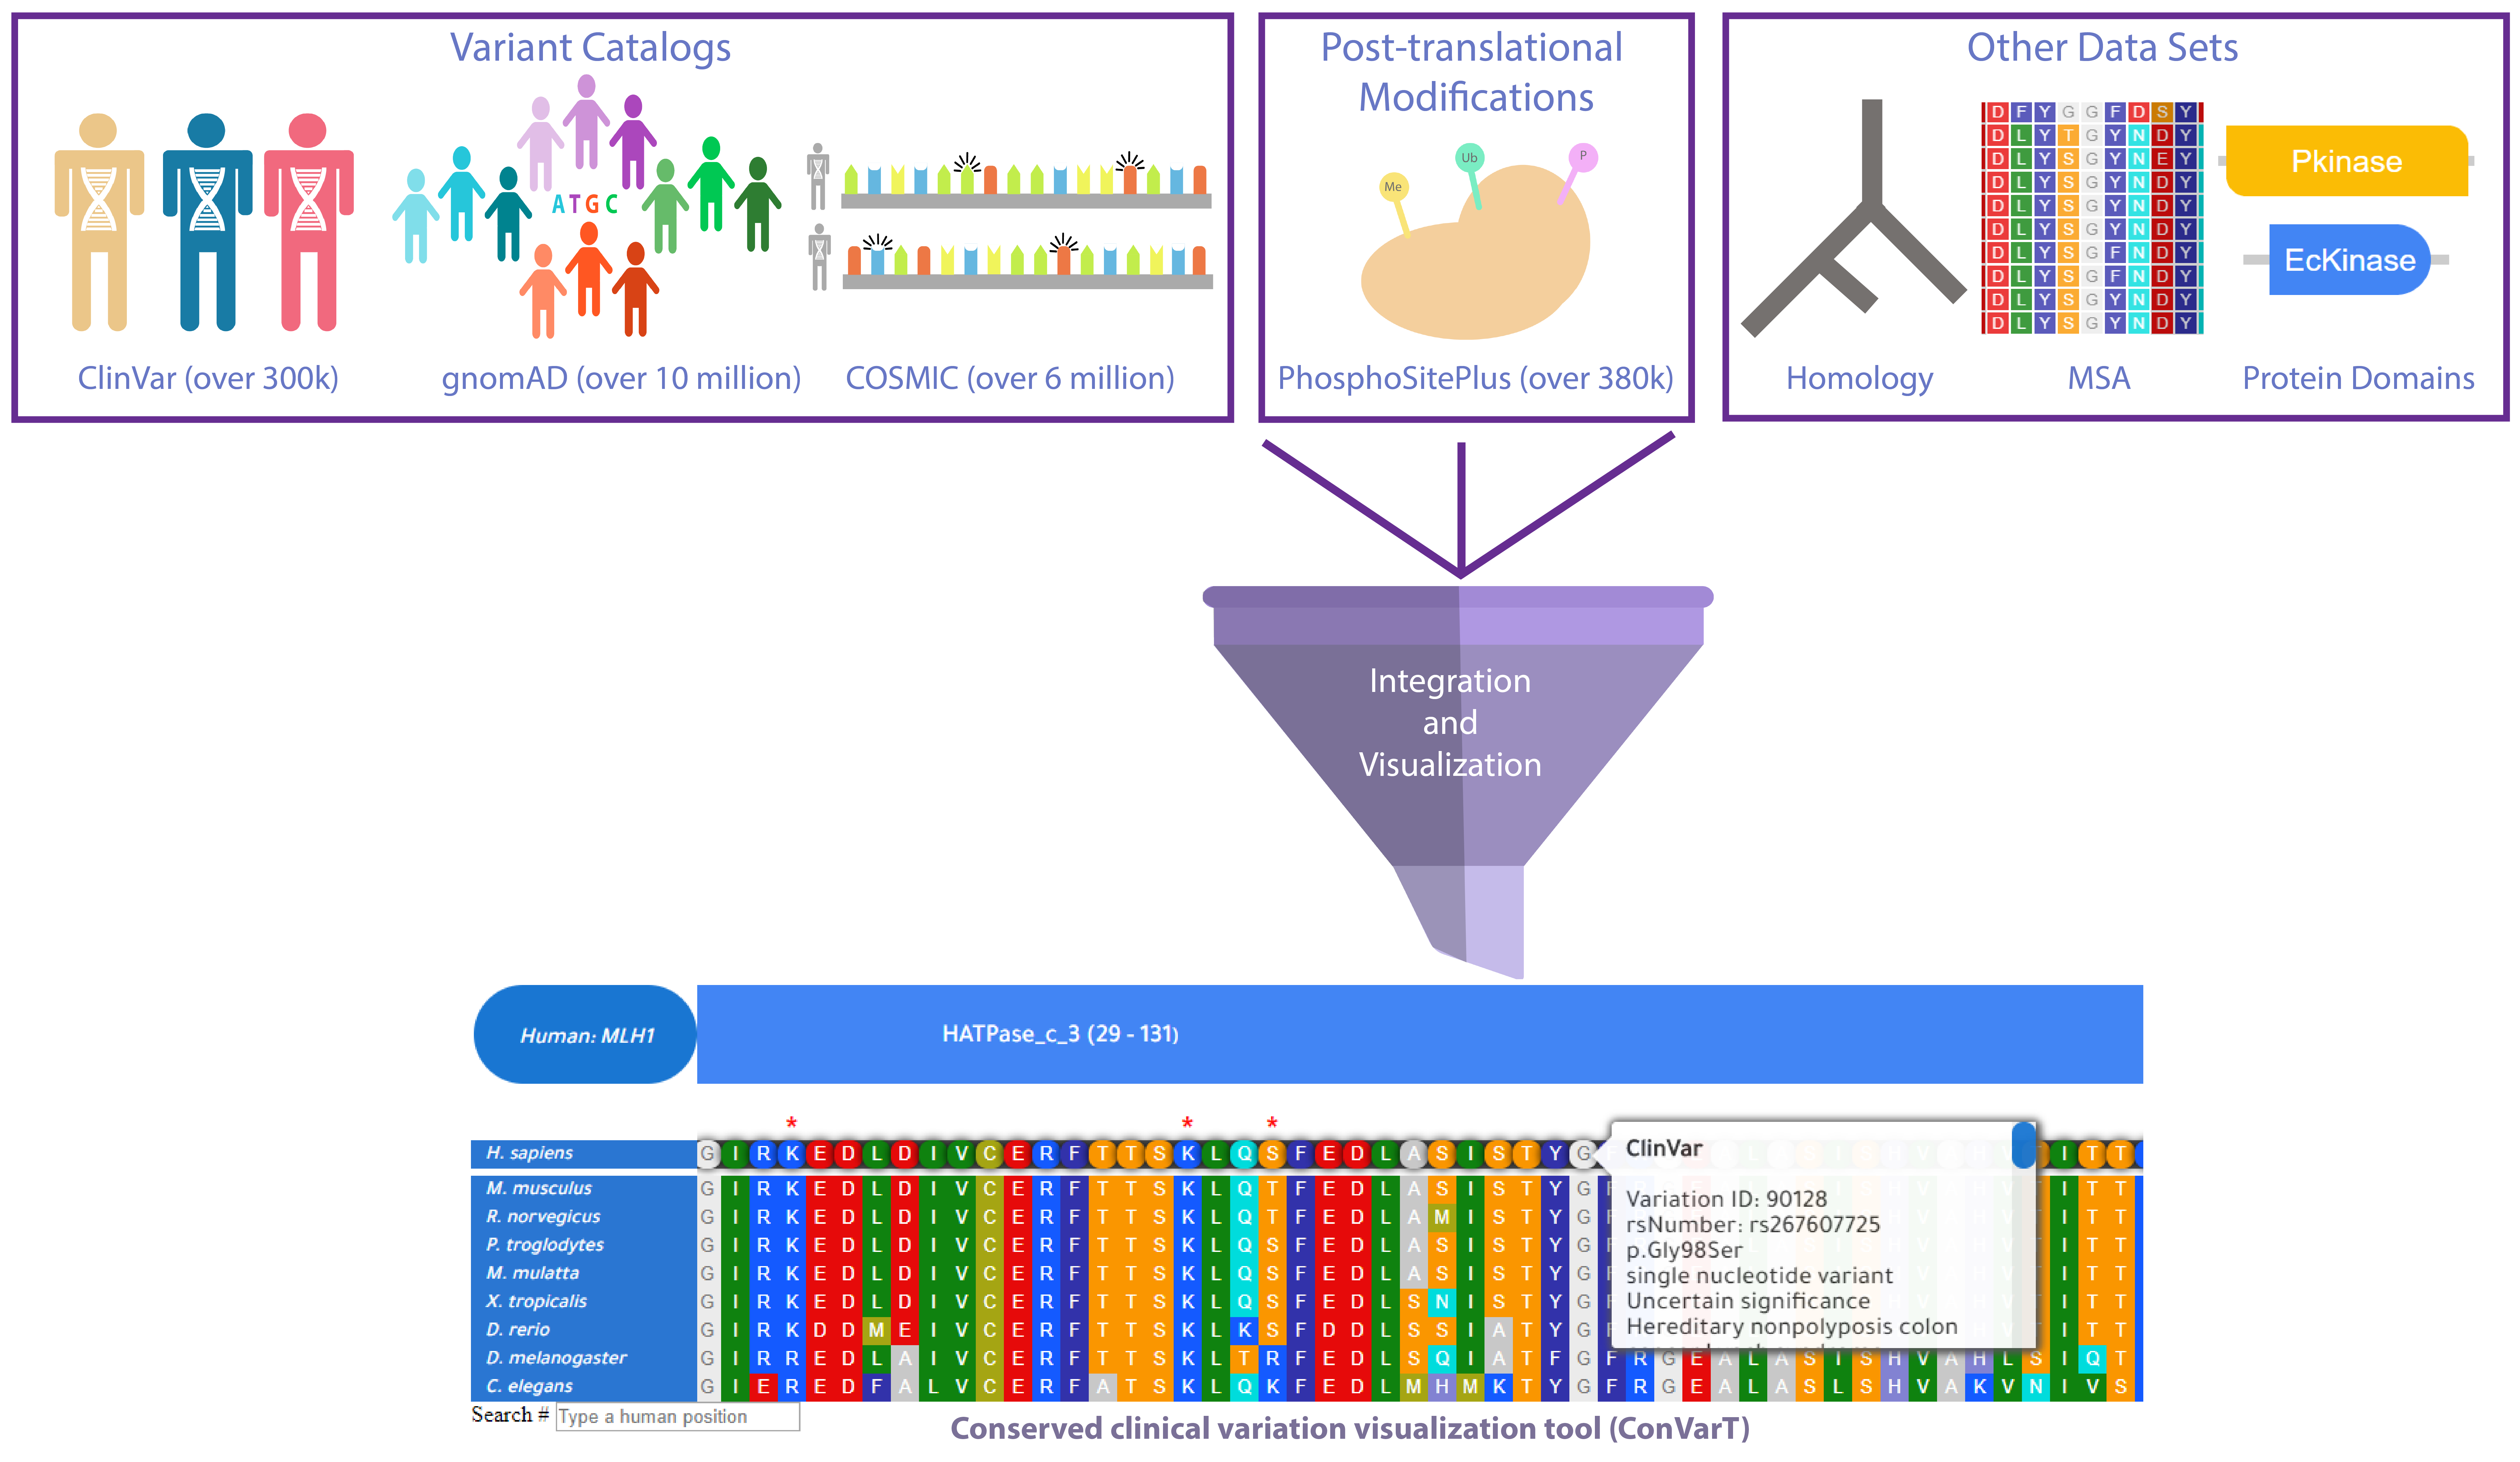
The conserved clinical variation visualization tool (ConVarT) is an online search engine for matching variants (MatchVars) between humans and mice, C. elegans developed by the Kaplan Lab. ConVarT integrated amino acid substitutions associated with diseases and non-clinically significant amino acid substitutions from ClinVar, COSMIC and gnomAD, dbSNP databases for humans, and amino acid substitutions from Mutagenetix for mouse and Wormbase for C. elegans, allowing easy access to collections of phenotypic, pathogenic, bening MatchVars and non-MatchVars between humans and mice, C. elegans for the model organism research and clinical scientist community. Protein domains and PTMs (post-translational modifications) are integrated into the corresponding positions of amino acids on the human protein sequences.
All genes consisting of all types of amino acid substitutions from ClinVar (329,338 amino acid variations), COSMIC (6,842,627 amino acid variations) and gnomAD (16,179,380 amino acid variations), dbSNP (1,086,546 amino acid variations), Mutagenetix (374,555 variants), Wormbase (406,844 variants) databases have been extracted, and a series of multiple sequence alignments of ortholog genes between Human, Mouse, and C. elegans were conducted, with integration of all amino acid substitutions and Pfam protein domains into the corresponding positions. The data visualization tool is freely available for the benefit of the scientific community.
Here is the outline of ConVarT workflow:
Why ConVarT might be useful?
It is presently challenging to determine the biological effects of the ever-increasing number of genetic variants. Apparently, the currently available functional inference computational tools are not sufficient to predict the impacts of missense variants, raising the issue of understanding the large scale of human genetic variations. Ease of knock-in with Cas9/CRISPR facilitates the single amino acid substitutions at any position, thus opening up a novel avenue to experimentally assess the functional effects of human genetic variants using model organisms including Mouse, Zebrafish, nematode C. elegans and Fruit fly Drosophila.However, the available databases can not easily provide rapid visualization of human genetic variants in the genome of model organisms. ConVarT enables researchers scientists to copy and paste their own protein sequence to view human genetic variations and PTMs in the respective amino acid positions, followed by the incorporation of Pfam protein domains, extending ConVarT's use to other model systems. Briefly, ConVarT provides easy access to all conserved human genetic variants and PTMs on protein-encoding regions. The database would be useful for the biomedical and model organism research communities.
How to use ConVarT?
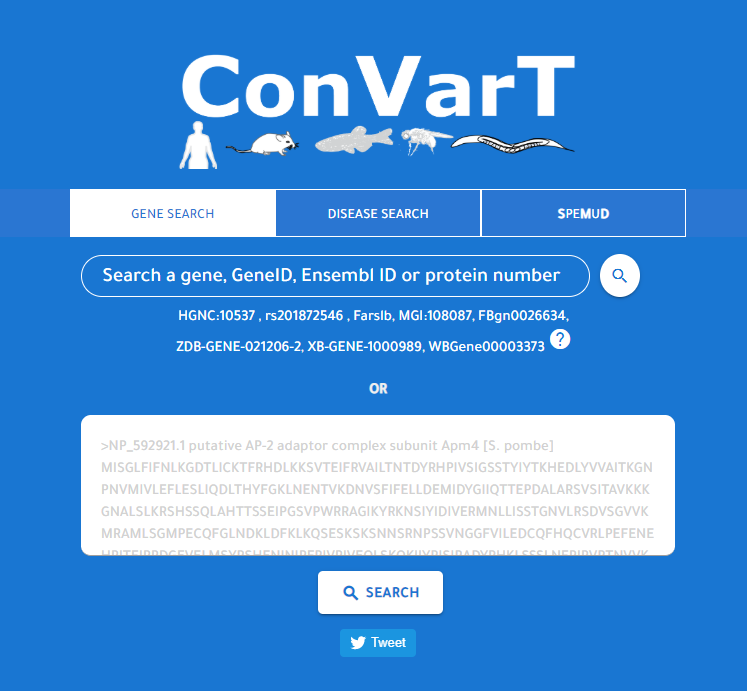
The detailed protocol about using ConVarT is now published and can be accessed from here.There are two ways to make a search on this site. You can simply write the gene identifiers you searched for such as gene name, synonyms or species-specific gene-identifiers like MGI ID, FlyBase ID ,etc. or you can use rs number in the search box on the ConVarT. More detailed information and the list of identifiers that can be used as an input is accessible on the FAQs page.
One important innovation of ConVarT is that you can copy and paste a protein sequence of a gene you're looking for into the search box on ConVarT page. Then, the protein sequence you have searched for will be aligned with the protein sequence of human homolog with the integration of human genetic variants, and together with PTMs (post-translational modifications) and Pfam protein domains. This novel feature enables the expansion of ConVarT use for other species.
Shown is the representative pipeline of protein sequence search:
To become more familiar with ConVarT, you can also watch our Tutorial Videos on the Help page.
Interactive Charts
Interactive charts are critical parts of ConVarT. The table below shows the number of transcript IDs (more than 100 thousand), variants (more than 20 million) and PTMs (more than 380 thousand). Interactive charts are generated for each transcript with the categorization of human genetic variants, meaning that a total of over 100,000 interactive charts were created on the ConVarT project. In addition, the same methodology is applied for PTMs, generating a total of over 20,000 interactive charts with the categorization of types of PTMs.For ClinVar, there is a number of different data sets that can be grouped into different categorization. For example, human genetic variations data coming from ClinVar can be grouped into 5 different sub-categories namely "Pathogenic", "Benign", "VUS", "Conflicts" and "Others". Human genetic variations for each gene are classified into these five sub-categories and visualized using interactive charts. Furthermore, PTMs (post-translational modifications) are also integrated into ConVarT and are categorized into types of post-translational modifications such as "Methylation", "Acetylation", "Ubiquitination" and others using interactive charts.
Importantly, each interactive chart is downloadable as ".png" or ".svg" format for publication or presentation. Also, the number of records in each category can be accessed by mousing over the segments of interactive charts. In addition, some sub-categories you are not interested in can be eliminated by clicking the names of the sub-categories.
| Source filter_list | # Unique Transcript ID filter_list | # Records in the Table filter_list | Last Update filter_list |
|---|---|---|---|
| COSMIC | 29,247 | 6,842,627 | 29 June, 2019 |
| gnomAD | 43,352 | 16,179,380 | 29 June, 2019 |
| ClinVar | 35,618 | 2,280,300 | 12 November, 2021 |
| PhosphoSitePlus | 21,282 | 383,095 | 29 June, 2019 |
| WormBase | 30,744 | 443,523 | 12 November, 2021 |
| Mutagenetix | 57,208 | 618,501 | 12 November, 2021 |
| APF | 8,474 | 21,186 | 12 November, 2021 |
| TOPMed | 95,223 | 39,891,272 | 12 November, 2021 |
Shown are the representative images of interactive charts for each data set:
ClinVar
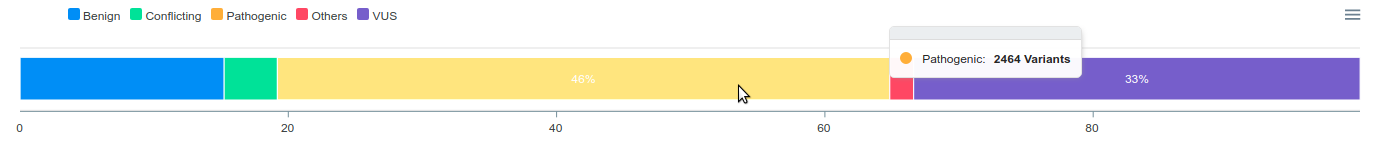
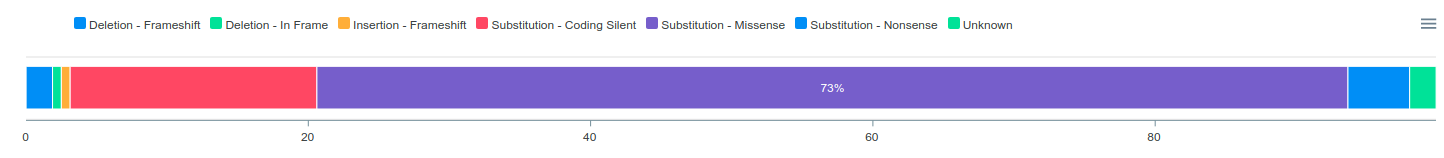
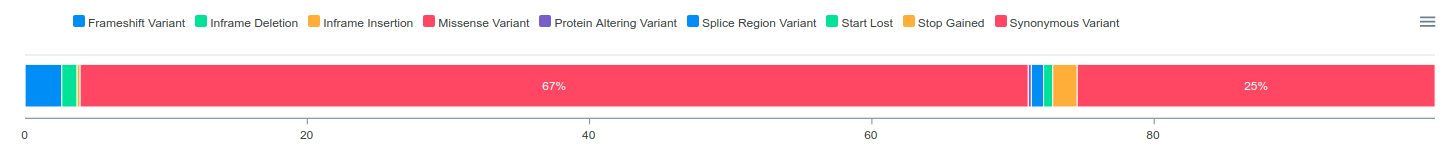
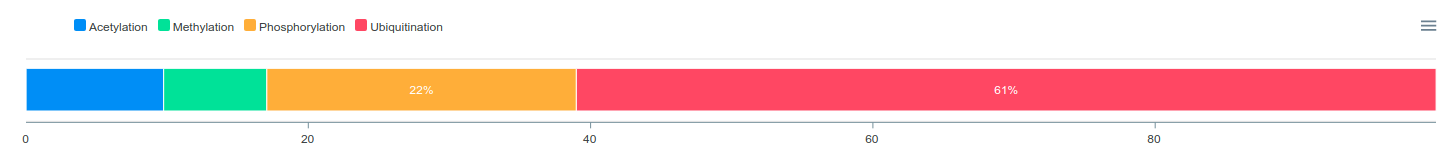
Table Features
ConVarT has incorporated various resources and brought a number of different novelties together. We always ensure, however, that users can also visit the source of the data from where we acquire it. Therefore, we provide a link that is represented as blue to each record for each data set in the tables.Each data set coming from ClinVar, gnomAD, COSMIC, PTMs, Pfam protein domains and disease-associated genes from DisGeNET are represented in the separate tables and then our search feature enables users to quickly search within the table. Furthermore, users can sort the table based on the column categorization.
Browse
If you are not interested in a specific gene or variant, you can inspect the Disease, ClinVar, PTM, gnomAD and COSMIC or Conservation Score and the Downloads page from the Explore menu.Help develop the ConVarT
To contribute to the development of ConVarT, you can suggest the inclusion of databases, resources or anything that can be useful to the community. Please, feel free to contact us through our Contact page.Open Source
Open source is critical to disseminate the information. ConVarT is ,therefore, an open source, free web-based tool, and coding and scripts used to generate all the information and the data are freely available. Scripts and the web-based tool can be accessed through our GitHub repository. Also, you can directly download the data from the Downloads page.Archiving Old Versions
ConVarT currently is in the first version. We are planning to archive old versions of ConVarT in the future.API
We are currently working on API system.Principal Investigators
Oktay I. Kaplan
Sebiha Cevik
Oktay I. Kaplan
Sebiha Cevik
Data Production Team
Mustafa S. Pir
Halil I. Bilgin
Furkan M. Torun
Mustafa S. Pir
Halil I. Bilgin
Furkan M. Torun
Web Site Team
Ahmet Sayıcı
Fatih Coskun
Halil I. Bilgin
Furkan M. Torun
Ahmet Sayıcı
Fatih Coskun
Halil I. Bilgin
Furkan M. Torun
Experimental Team
Mustafa S. Pir
Pei Zhao (SunyBiotech Co.,Ltd)
Yahong Kang (SunyBiotech Co.,Ltd)
Mustafa S. Pir
Pei Zhao (SunyBiotech Co.,Ltd)
Yahong Kang (SunyBiotech Co.,Ltd)