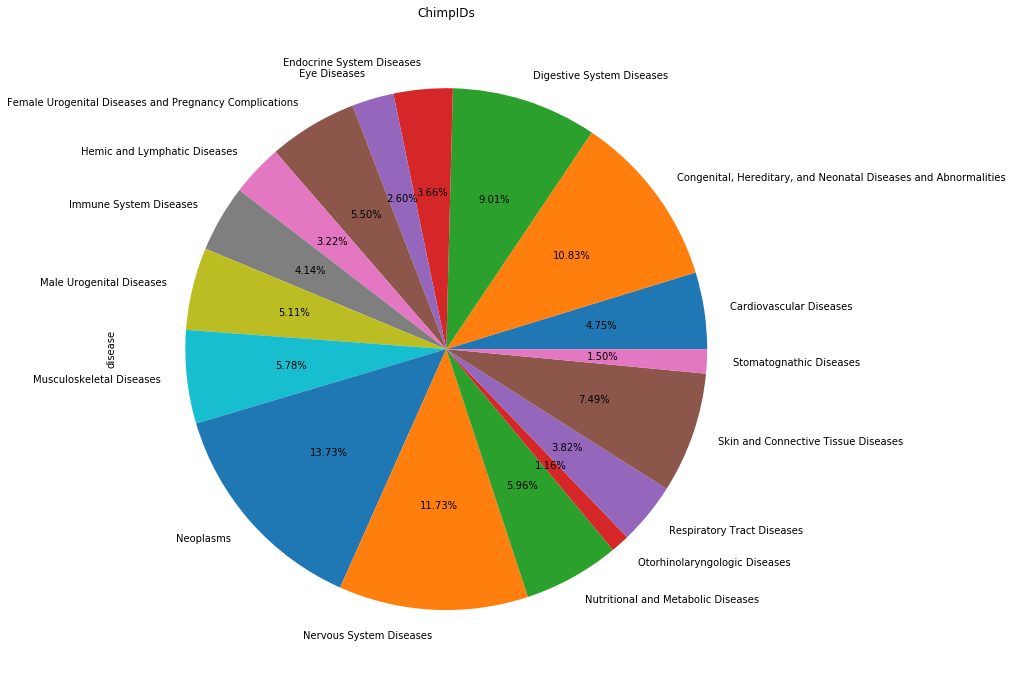
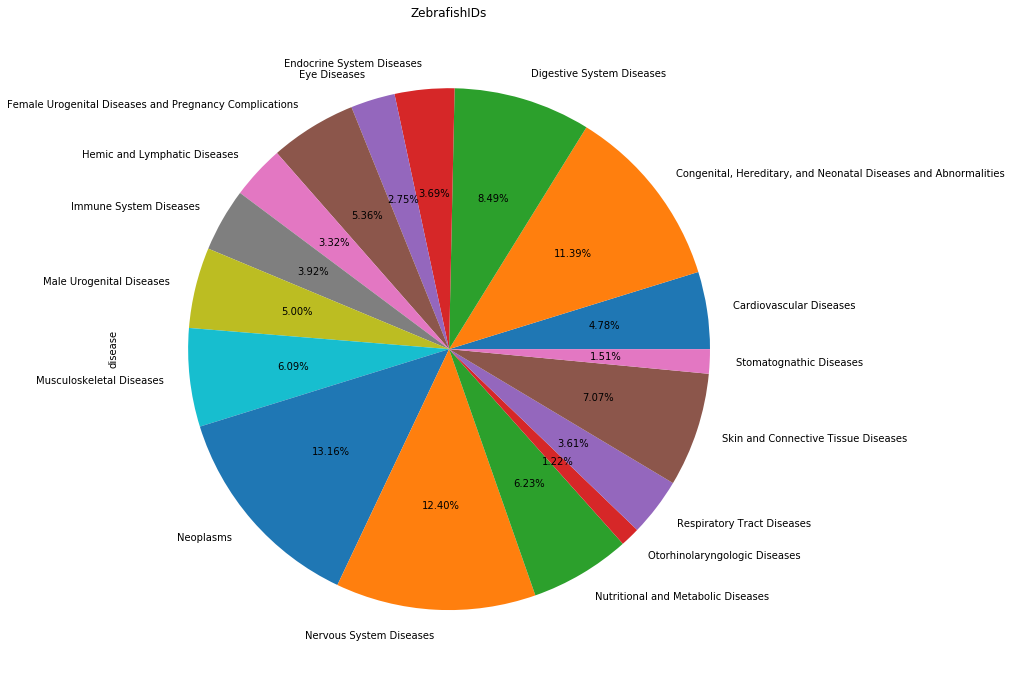
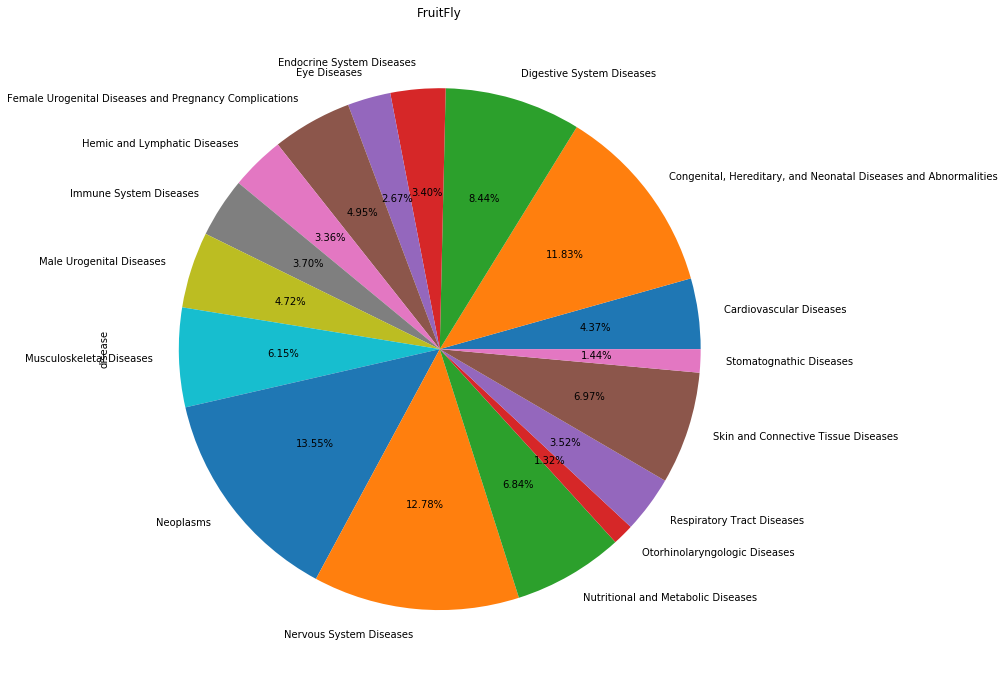
Disease Statistics
Homologs of disease-associated genes have been generated to display pie-chart for each species with an aim of showing disease categorization. DisGeNET dataset has been used as a resource.You can download the high-resolution image of graphs. Please, click the graphs you interested in.
Categorization of disease produced with genes associated with disease
Chimp
Macaca

Mouse

Rat

Zebrafish
Frog

Fruit fly
C. elegans
